Comprehensive Guide to Media Measurement
Introduction
Media measurement is the science and art of quantifying, analyzing, and optimizing the delivery and impact of media campaigns across platforms—TV, radio, print, digital, and out-of-home (OOH). In an age of multi-screen consumption, audience fragmentation, and performance-driven marketing, media measurement provides the foundation for informed decision-making and strategic investment. This essay explores all key media measurement concepts, using global and Indian examples and case studies, and provides insights into their application in real-world campaigns.
1. Reach
Definition
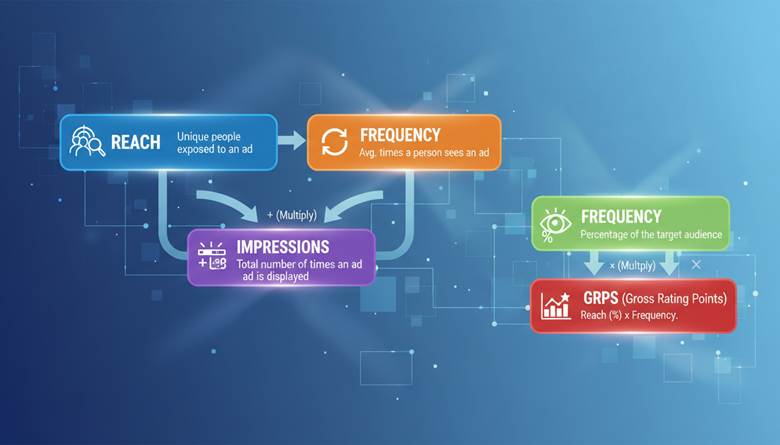
Reach refers to the total number of unique individuals or households exposed to a media vehicle or campaign at least once over a specific period. It is usually expressed as a percentage of the target audience or as an absolute number.
- In television, reach is the percentage of viewers who watch a program or advertisement at least once.
- In digital, reach is the number of unique users who have seen a banner, video, or post at least once.
- In print, reach is the number of unique readers of a publication.
Calculation
Reach (%) = (Number of unique viewers exposed / Total target audience) x 100
Example:
A TV ad for an Amul ice cream campaign is aired in Mumbai, which has a potential TV viewing population of 10 million. If 2 million unique people watch the ad at least once during the campaign,
Reach = (2,000,000 / 10,000,000) x 100 = 20%
Importance
- Brand Awareness: High reach ensures that more people know about the product or campaign.
- Benchmark for Success: Used as a KPI for mass-market campaigns (e.g., FMCG, telecom, banking).
- Media Planning: Helps in planning how widely a campaign should be disseminated.
Case Study: “Jio Dhan Dhana Dhan” Campaign
When Reliance Jio launched its “Dhan Dhana Dhan” offer, the campaign was aired across 50+ TV channels and all major digital platforms to maximize reach. The campaign’s objective was to reach at least 80% of urban and rural mobile users within 2 weeks. According to TAM Media Research, the campaign achieved a reach of over 250 million unique viewers, making it one of the widest-reaching telecom launches in India.
2. Frequency
Definition
Frequency measures the average number of times a person or household is exposed to a particular media message during a campaign period.
Calculation
Frequency = Total Impressions / Reach
Example:
If a campaign delivers 30 million impressions to 10 million people during a week:
Frequency = 30,000,000 / 10,000,000 = 3
Significance
- Memory and Persuasion: Repetition increases the likelihood that an individual will recall and act on the message.
- Optimal Frequency: Too low may not register; too high may cause diminishing returns or ad fatigue.
- Media Optimization: Helps balance budget between reaching more people (reach) and reinforcing the message (frequency).
The Frequency Dilemma
- Effective Frequency: The minimum number of exposures needed for an ad to be effective (often considered 3 exposures).
- Wear-Out: Excessive frequency can cause negative sentiment (irritation or tuning out).
Case Example: Cadbury Dairy Milk “Kuch Meetha Ho Jaaye”
During Diwali, Cadbury Dairy Milk targets a frequency of 4+ for core audience segments (urban mothers). Media planners schedule TV and digital ads so most target viewers see the ad at least 4 times, reinforcing Diwali-related gifting and consumption.
3. GRPs (Gross Rating Points) and GVT (Gross Viewership in Thousands)
Definition
GRPs (Gross Rating Points) are a cumulative measure of campaign exposure, multiplying reach (as a percentage) by frequency.
GVT (Gross Viewership in Thousands) is India-specific, denoting the sum total of viewers (in thousands) exposed to a campaign or program.
Calculation
GRPs = Reach (%) x Frequency
GVT = Total impressions (in thousands)
Example:
- If reach is 40% and frequency is 5, then GRPs = 40 x 5 = 200 GRPs.
- If a show is viewed by 4 million people, GVT = 4,000.
Role in Planning
- Campaign Volume: GRPs allow planners to compare different campaigns irrespective of schedule or channel.
- Inventory Buying: TV ad inventory is often sold in GRP packages.
Indian Example: IPL 2023
During IPL 2023, Disney+ Hotstar and Star Sports delivered over 25,000 GVTs for the full tournament. Top sponsors like Dream11, CRED, and Unacademy bought packages based on projected GRPs to ensure they would hit targeted exposure levels for their products.
4. TRP (Television Rating Point) / TVT (Television Viewership in Thousands)
Definition
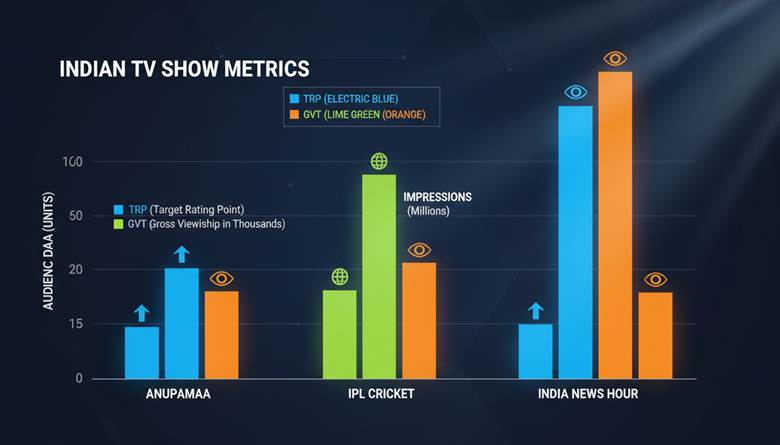
TRP measures the popularity of a TV program, representing the percentage of the target audience viewing a specific show or slot at a given time.
TVT indicates the total number of viewers (in thousands).
Calculation
TRP = (Number of viewers for a program / Total target audience) x 100
TVT = Number of viewers in thousands
Example:
A soap opera is watched by 1 million viewers out of a 20 million TV audience:
TRP = (1,000,000 / 20,000,000) x 100 = 5
Importance
- Program Popularity: Networks and advertisers use TRP to determine which shows attract the most viewers.
- Ad Pricing: High TRP shows command premium ad rates.
Indian Context: BARC Ratings
BARC (Broadcast Audience Research Council) is India’s official TRP measurement body.
Example: “Anupamaa” on Star Plus has consistently topped BARC charts with TRPs above 4.0, drawing brands like Colgate and Britannia to advertise.
5. Impressions
Definition
Impressions are the total number of times an ad or content is displayed, regardless of whether it’s watched, clicked, or read in full.
- In TV: Number of times an ad is broadcast and potentially seen.
- In digital: Number of times a banner/video is loaded on users’ screens.
Calculation
Impressions = Reach x Frequency
Example:
If a campaign has a reach of 2 million and frequency of 5:
Impressions = 2,000,000 x 5 = 10,000,000
Application
- Measuring Exposure: High impressions indicate widespread delivery.
- Digital Billing: Most digital ad buys (CPM) are billed on impressions.
Case Study: Amazon Great Indian Festival
Amazon’s 2022 Great Indian Festival campaign delivered over 1.5 billion impressions across YouTube, Facebook, and OTT platforms in 10 days, ensuring massive visibility for the sale event.
6. Cost Efficiency
Definition
Cost efficiency is the measure of how effectively a media campaign achieves its objectives within a given budget, often analyzed through cost per impression, cost per reach, or cost per acquisition.
Key Metrics
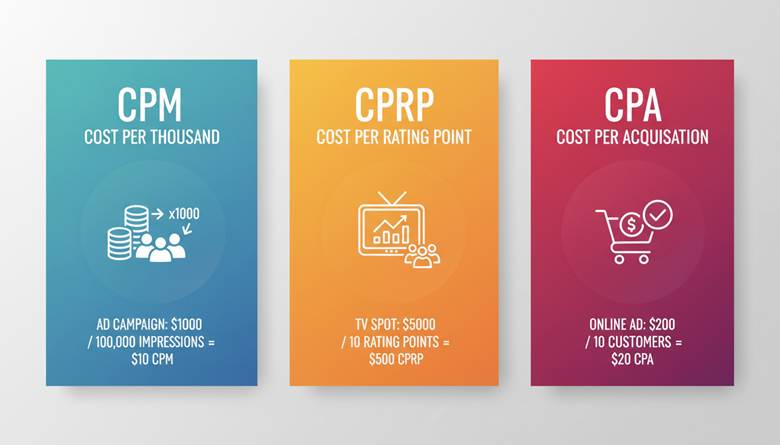
- CPM (Cost per Mille or Thousand): Cost per 1,000 impressions.
- CPA (Cost per Acquisition): Cost to acquire one customer.
- CPL (Cost per Lead): Cost to get a single lead.
Importance
- Budget Optimization: Ensures that every marketing rupee delivers maximum impact.
- Channel Comparison: Helps marketers find the most cost-effective media for their goals.
Example: Tata Motors’ Car Launch
Tata Motors evaluated TV, print, and YouTube campaigns for a Tiago launch.
- TV CPM: ₹120
- Print CPM: ₹95
- YouTube CPM: ₹55
YouTube provided the best cost efficiency for urban millennial targeting.
7. Cost Per Thousand (CPM)
Definition
CPM is the cost incurred to deliver 1,000 impressions of an ad.
Calculation
CPM = (Total Ad Cost / Total Impressions) x 1,000
Example:
A Facebook ad costs ₹20,000 for 500,000 impressions:
CPM = (₹20,000 / 500,000) x 1,000 = ₹40
Significance
- Standard Metric: Used for buying/selling ad space across TV, print, radio, OOH, and digital.
- Media Comparison: Enables comparison of efficiency across channels on a per-1,000 reach basis.
Case Study: IPL TV vs. Hotstar CPMs
In IPL 2022, TV CPMs for prime matches hit ₹180–₹220, while Disney+ Hotstar’s CPMs ranged from ₹120–₹150, making digital a cost-effective reach builder for brands targeting young urban audiences.
8. Cost per Rating Point (CPRP)
Definition
Cost per rating point (CPRP) is the cost for achieving one rating point (i.e., reaching 1% of the target audience) in a TV campaign.
Calculation
CPRP = Total Cost / GRPs
Example:
If a shampoo brand spends ₹5,00,000 and achieves 100 GRPs:
CPRP = ₹500,000 / 100 = ₹5,000
Relevance
- Efficiency Benchmark: TV ad buyers use CPRP to benchmark the cost-efficiency of different media vehicles.
- Ad Rate Negotiations: Lower CPRP means more efficient buys for advertisers.
Indian Example: FMCG TV Buys
During festive seasons, FMCG brands negotiate lower CPRPs by bulk-buying ad spots across high-TRP serials on Star Plus, Zee TV, and Colors, maximizing exposure at better rates.
9. Circulation, Readership, and AIR (Average Issue Readership)
Circulation
- Definition: Number of physical copies distributed per issue of a publication.
- Example: The Times of India’s certified daily circulation is about 2.8 million copies (as per Audit Bureau of Circulation).
Readership
- Definition: Number of people who read or interact with a publication, often higher than circulation due to pass-along readership.
- Example: Each TOI copy is read by 2.5 people on average, giving a total readership of 7 million.
AIR (Average Issue Readership)
- Definition: The average number of people who read a specific issue (typically “last day” for dailies, “last week” for magazines).
- Importance: AIR is the key metric for print media planning and ad pricing in India.
Case Study: Dainik Bhaskar
Dainik Bhaskar, India’s largest circulated Hindi daily, boasts an AIR of 15 million, making it an irresistible platform for brands targeting Hindi-speaking markets.
10. Selectivity Index
Definition
Selectivity Index measures a medium’s ability to reach a particular target segment relative to the general population.
Calculation
Selectivity Index = (Percentage of target group in media audience / Percentage of target group in population) x 100
Example:
If 65% of Femina magazine’s readers are women, and women constitute 48% of the general population:
Selectivity Index = (65 / 48) x 100 = 135
Use
- Niche Marketing: High index means the medium is efficient for the target audience.
- Media Planning: Used to select vehicles for specific demographics (e.g., regional language newspapers for local campaigns).
Example: Radio City Bangalore
Radio City has a selectivity index of 180 for 18–34 year-olds in Bangalore, making it highly effective for youth-oriented brands.
11. Share of Voice (SOV)
Definition
Share of Voice (SOV) is the percentage of total advertising presence (spend, impressions, or GRPs) a brand commands in a given category and time period.
Calculation
SOV (%) = (Brand’s ad spend or impressions / Total market ad spend or impressions) x 100
Example:
If Britannia spends ₹10 crore on bakery ads in Q1, and the total bakery category ad spend is ₹50 crore:
SOV = (10 / 50) x 100 = 20%
Importance
- Competitive Benchmark: SOV vs. market share helps gauge competitive pressure.
- Market Share Growth: Brands with SOV > market share are likely to grow share (“excess SOV” principle).
Indian Example: Cola Wars
During IPL, Pepsi and Coca-Cola both aim for a high SOV. The brand with higher SOV during the tournament often sees a post-IPL uptick in market share.
12. Integrated Campaign Planning Using Media Metrics
Step 1: Define Objectives
- Awareness (maximize reach)
- Frequency (reinforce message)
- Engagement (digital, social)
- Sales/response
Step 2: Select Media Mix
- TV: Mass reach, high GRPs/TRPs
- Digital: Targeted reach, impressions, CPM, SOV
- Print: Credibility, high selectivity for regional/language targets
- Radio: Local frequency, selectivity
- OOH: Urban reach, frequency
Step 3: Set KPIs and Track Performance
- Reach, frequency, GRPs, impressions, CPM, CPRP, SOV, AIR, selectivity index
Step 4: Optimize
- Reallocate budgets to best-performing channels.
- Adjust creative based on frequency/wear-out.
- Shift SOV as per competitive activity.
13. Challenges and Innovations in Indian Media Measurement
Challenges
- Audience Fragmentation: OTT, mobile, and social media erode traditional TV/print dominance.
- Data Transparency: Third-party audits are crucial but sometimes lacking.
- Cross-Platform Measurement: Unified metrics for TV, digital, OOH still evolving.
- Ad Fraud: Especially in digital (bots, fake impressions, viewability concerns).
Innovations
- BARC’s EKAM: An upcoming platform to unify TV and digital measurement.
- Digital Panels: Agencies like Comscore, Nielsen, and Kantar deploy digital panels for multi-platform tracking.
- Big Data Integration: Telecom and e-commerce players use big data for hyper-targeted media buying.
14. Case Studies
A. Case Study: “Baahubali 2” Media Blitz
Objective: Create a pan-India blockbuster with mass reach.
- TV: Over 700 GRPs across Hindi, Tamil, Telugu channels in Week 1.
- Digital: 300+ million impressions on YouTube, Facebook, and Hotstar.
- Print: 40 million AIR across front-page ads in top dailies.
- Radio: Top 20 cities, high selectivity index for urban youth.
- SOV: Baahubali 2 outspent all other film releases in April 2017, dominating SOV and box office.
B. Case Study: “Swiggy Instamart” Digital Ramp-up
- Impressions: 1 billion+ in 2 months across social and OTT.
- CPM: ₹35–₹60, lower than TV and print.
- Selectivity Index: High among urban millennials and Gen Z.
- SOV: Swiggy captured 55% SOV in the instant delivery category, outpacing Zepto, Dunzo, and Blinkit in the same quarter.
15. Formulas & Quick Reference Table
| Metric | Formula | Example |
| Reach (%) | (Unique Exposed / Total Audience) x 100 | (2,000,000 / 10,000,000) x 100 = 20% |
| Frequency | Total Impressions / Reach | 30,000,000 / 10,000,000 = 3 |
| GRPs | Reach (%) x Frequency | 40 x 5 = 200 |
| TRP | (Viewers for Program / Total Audience) x 100 | (1,000,000 / 20,000,000) x 100 = 5 |
| Impressions | Reach x Frequency | 2,000,000 x 5 = 10,000,000 |
| CPM | (Cost / Impressions) x 1,000 | (₹20,000 / 500,000) x 1,000 = ₹40 |
| CPRP | Cost / GRPs | ₹500,000 / 100 = ₹5,000 |
| AIR | Readership per Issue | Dainik Bhaskar AIR = 15 million |
| Selectivity Index | (% in media / % in population) x 100 | (65 / 48) x 100 = 135 |
| SOV (%) | (Brand Spend / Total Category Spend) x 100 | (10 / 50) x 100 = 20% |
Conclusion
Mastering media measurement is essential for modern marketers, agencies, and media buyers. It enables precise planning, delivers accountability, and ensures maximum impact for every media investment. In the Indian context, with its vast, diverse, and rapidly digitizing audience, a deep understanding of reach, frequency, ratings, impressions, cost efficiency, and selectivity is critical to cutting through the clutter and building winning brands.